Businesses rely on data more than ever before to make reasoned decisions. Many businesses now track the various ways that users interact with their products, services, and each other. Users can number in the millions, which creates a tremendous amount of raw data.
To understand and utilize data, you first have to understand the implications of datasets. This is why everyone who wants to understand data better and improve the success of their business must develop the skills necessary to become a data scientist. Understanding data is one of the most important things you can do to improve your understanding of your product and your marketing, especially when huge amounts of raw, uninterpreted data can be misleading. As the novelist, Jorge Luis Borges aptly noted, understanding data is a way of “safeguarding order in an era of disorder.”
Breaking Down Data
Data scientists collect and transform data into useful information. Specifically, data scientists specialize in identifying patterns in data that can then be used to make predictions. Data scientists are also discerning – they understand how to spot and separate false clues or “noise” (patterns that appear to be present in datasets but are actually random variations in data) from real data trends. As Jedidiah Berry notes in his work, The Manual of Detection, “Most everything can be divided into two categories: details and clues. Knowing one from the other is more important than knowing your left shoe from your right.”
Information can be extracted from data in many ways. Sometimes information is discovered by finding trends. For instance, data can provide information about what most users think of your product. Data can also reveal which product feature is the least liked by users. When data scientists obtain enough evidence to address these points, solid information emerges that can be used to make sound decisions.

Data scientists typically break down data in two ways: descriptively and inferentially.
1) Datasets are most easily broken down into descriptive statistics. For example, data scientists provide the mean (average value) and variance (a measure of whether data are all close to the mean or spread far apart). This role is the easiest for the amateur data scientist to assume as it basically involves a superficial analysis of datasets, while it generally takes a more seasoned data scientist to provide sound inferential data.
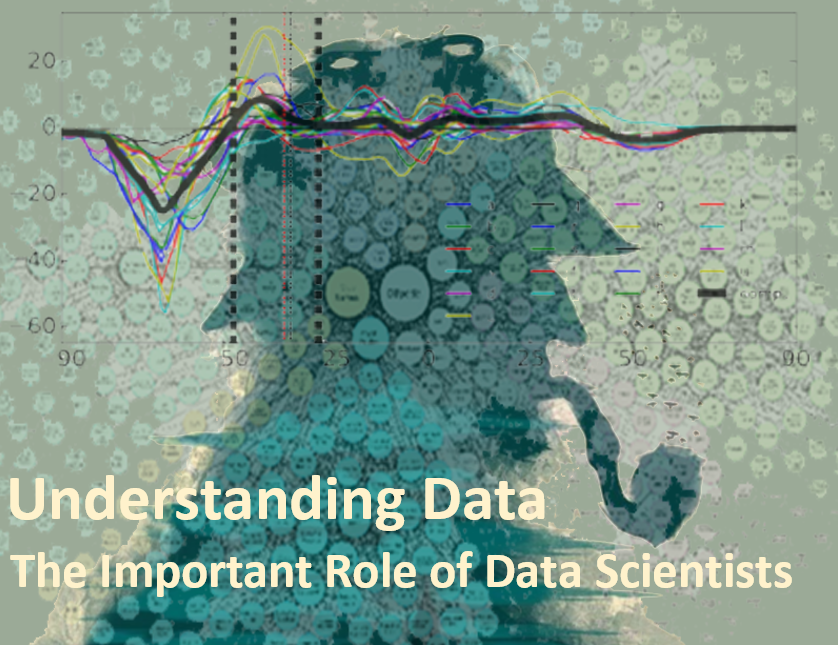
2) Inferential data involves significance tests. These are mathematically based tests that determine whether an apparent pattern is real or due to chance occurrences. Inferential data is what ties the trend together, providing a measured look at dataset means and variances as it relates to the overall scheme of things. For instance, Sherlock Holmes uses descriptive statistics (clay) to draw inferences (bricks) that reveal the perpetrator of the crime.
“Data! Data! Data!” he cried impatiently. “I can’t make bricks without clay.”
– Sherlock Holmes, from The Adventure of the Copper Beeches, 1892
The Data Scientist’s Essential Guidelines
Successful data scientists typically carry out the following duties:
- Write queries to gather information
- Search datasets to uncover clues
- Conduct surveillance / observe data patterns
- Collect evidence / data to present to clients or employers
- Verify data accuracy
- Check data records to chart trends over time
- Investigate datasets
SlashDB as Your Data Science Tool
The technical challenges in interpreting data and using it to make informed decisions is perhaps best addressed by adopting an API add-on such as SlashDB. At SlashDB, we focus on creating APIs with both high accessibility and heightened searchability. Our API add-on relies on a “what you see is what you get” set-up. This kind of set-up increases the speed and efficiency of data extraction. Our technology![]() enables you to access your data through multiple platforms so you can review and analyze data on the go. Our API also creates a unique hyperlink for each individual piece of data, making it easier to piece together trends and understand patterns in your datasets. For instance, a URL data pointer for a customer table will lead to a pointer for a specific customer within that table, which will, in turn, lead to a specific property of the customer, such as an email address or invoices. Data exposed at this granular level, like small breadcrumbs dropped along a logical path of thought, provide a trail or map that allows data scientists to interpret and understand data trends on an incredibly minute level.
enables you to access your data through multiple platforms so you can review and analyze data on the go. Our API also creates a unique hyperlink for each individual piece of data, making it easier to piece together trends and understand patterns in your datasets. For instance, a URL data pointer for a customer table will lead to a pointer for a specific customer within that table, which will, in turn, lead to a specific property of the customer, such as an email address or invoices. Data exposed at this granular level, like small breadcrumbs dropped along a logical path of thought, provide a trail or map that allows data scientists to interpret and understand data trends on an incredibly minute level.
Contact us at SlashDB and we’ll work with you to find the best API add-on configuration for your business (and data detection) needs.