
D3.js is one of those useful tools that make visualizing data fun and interactive. So we’ll show you how to expand your use of SlashDB with D3. Since SlashDB’s API provides access to your data in the formats, HTML, JSON, CVS, XML, and XSD and D3 has a similar line up of file types it can support when loading data, the two entities – SlashDB and D3.js – are well paired for mating data access to data viz. While Mike Bostock wrote wrote the D3 library, there have been and continue to be many active contributors adding a diverse set of components and plugins. In addition to the original framework, in this post, we’ll explore a couple of D3 extensions that make writing the Javascript easy, even for novice coders. And since D3 focuses on binding data to DOM elements and SlashDB is all about reaching back into relational databases, through examples, we’ll see that perfect marriage.
Classic D3.js
SlashDB maintains a feature called SQL Pass-thru which enables us to execute custom defined queries and make them available as part of the SlashDB RESTful API. We’ll use the included sample database, Chinook, and compose a custom SQL select statement to query for the aggregate sales per year of purchased songs.
Note: our demo SlashDB instance has implemented an API for a sample Chinook database model. Details of this relational database example project can be found at https://github.com/lerocha/chinook-database . The Chinook data model represents a digital media store (e.g. iTunes), including tables that include artists, their albums and a plethora of album track data.
In SlashDB we navigate Configure > Queries to include the select statement:
select cast(strftime('%Y', InvoiceDate) as integer) as Year, sum(Total) as Total
  from Invoice
  group by strftime('%Y', InvoiceDate)
We also set parameters for access to the data and select the GET method of HTTP to read the data.
You can see the output of the SQL Pass-thru based SlashDB API call at:
http://demo.slashdb.com/query/sales-by-year.html
The following code makes the the above query, altered by selecting JSON as the choice for SlashDB’s formats for the data output. The user may also choose XML (the parsing of this selection is shown later), or CSV (another example using this format is shown later) as the data with which to work.
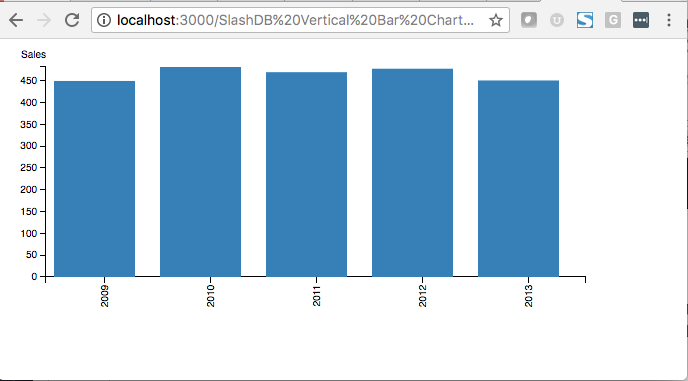
This example D3 code creates a vertical bar chart to display the sales totals across five years of sample data in the Chinook database:
<!DOCTYPE html>
<meta charset="utf-8">

<head>
	<title>SlashDB JSON Based Vertical Bar</title>
	<style>

  .bar{
    fill: steelblue;
  }

  .bar:hover{
    fill: brown;
  }

	.axis {
	  font: 10px sans-serif;
	}

	.axis path,
	.axis line {
	  fill: none;
	  stroke: #000;
	  shape-rendering: crispEdges;
	}

	</style>
</head>

<body>
<script src="http://d3js.org/d3.v3.min.js"></script>
<script>
// set the dimensions of the canvas
var margin = {top: 20, right: 20, bottom: 70, left: 40},
    width = 600 - margin.left - margin.right,
    height = 300 - margin.top - margin.bottom;


// set the ranges
var x = d3.scale.ordinal().rangeRoundBands([0, width], .05);

var y = d3.scale.linear().range([height, 0]);

// define the axis
var xAxis = d3.svg.axis()
    .scale(x)
    .orient("bottom")


var yAxis = d3.svg.axis()
    .scale(y)
    .orient("left")
    .ticks(10);


// add the SVG element
var svg = d3.select("body").append("svg")
    .attr("width", width + margin.left + margin.right)
    .attr("height", height + margin.top + margin.bottom)
    .append("g")
    .attr("transform",
          "translate(" + margin.left + "," + margin.top + ")");


// load the data from SlashDB via a RESTful API to the resource for the SQL Pass-thru (query)
d3.json("http://demo.slashdb.com/query/sales-by-year.json", function(error, data) {

    data.forEach(function(d) {
        d.Year = d.Year;
        d.Total = +d.Total;
    });

  // scale the range of the data
  x.domain(data.map(function(d) { return d.Year; }));
  y.domain([0, d3.max(data, function(d) { return d.Total; })]);

  // add axis
  svg.append("g")
      .attr("class", "x axis")
      .attr("transform", "translate(0," + height + ")")
      .call(xAxis)
      .selectAll("text")
      .style("text-anchor", "end")
      .attr("dx", "-.8em")
      .attr("dy", "-.55em")
      .attr("transform", "rotate(-90)" );

  svg.append("g")
      .attr("class", "y axis")
      .call(yAxis)
      .append("text")
      .attr("y", -16)
      .attr("dy", ".71em")
      .style("text-anchor", "end")
      .text("Sales");


  // Add bar chart
  svg.selectAll("bar")
      .data(data)
    .enter().append("rect")
      .attr("class", "bar")
      .attr("x", function(d) { return x(d.Year); })
      .attr("width", x.rangeBand() - 20)
      .attr("y", function(d) { return y(d.Total); })
      .attr("height", function(d) { return height - y(d.Total); });

});

</script>

</body>
The output of this code is:
Should the user have selected, for example, an XML payload from SlashDB, the call and subsequent parse of this data in D3 would be:
d3.xml("http://demo.slashdb.com/query/sales-by-year.xml", function(error, data) {

	data = [].map.call(data.querySelectorAll("row"), function(row) {
     return {
       Year: row.querySelector("Year").textContent,
       Total: +row.querySelector("Total").textContent
     };
    });
D3.js Extension: d3-ez
Now, let’s look at a D3 extension called d3-ez. You can learn more about d3-ez here: https://github.com/jamesleesaunders/d3-ez/blob/master/README.md
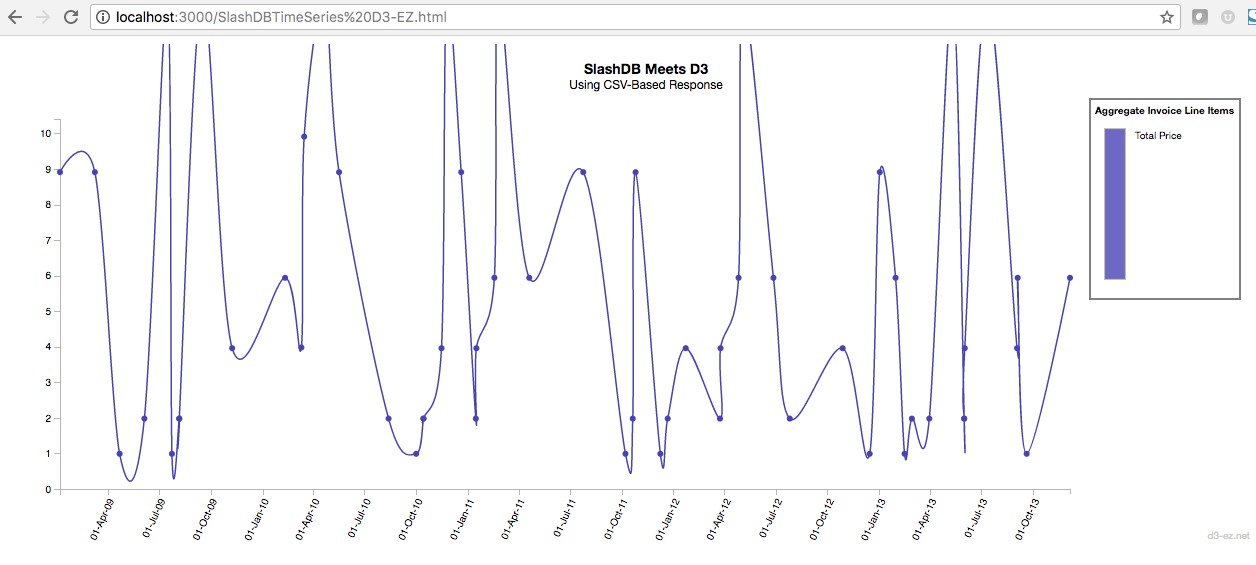
In the following example, we’ll call SlashDB’s API, reading the data back in CSV format. We’ll return an array of data that filters for one specific country: Canada and returns the invoice dates and total purchase amount for those invoice dates.
You can see the output of this RESTful API by clicking below:
https://demo.slashdb.com/db/Chinook/Invoice/BillingCountry/Canada/InvoiceDate,Total,BillingCountry.html
SlashDB Has the Query Filter You Need
In the SlashDB API call we use one of the simplest filtering construct which is comparison of an exact value: /[column_name]/[value] …or in our example …/BillingCountry/Canada…
SlashDB allows for other filtering methods such as Or, And, Search by Substring, Search by Ranges. More details on each filtering method can be found at:
https://docs.slashdb.com/user-guide/data-discoverymdgetting-around-data.html#filtering
Additionally, we selectively return three of the columns of the Invoice table by including their specific names in the construct of the RESTful API. They are InvoiceDate, Total, and BillingCountry. The latter is not used in the production of the chart but is provided for illustration.
For our D3-based invocation of the SlashDB resource, we’ll simply change the trailing .html that you see above to .csv and parse the results accordingly.
Here is the code that displays a time series chart for the above data. It exploits the d3-ez framework for simplifying the design of a time series chart output through its various chart components such as legend, title, chart (and subsequently chart type lineChart) that provided by d3-ez:
<!DOCTYPE html>
<html>

<head>
  <title>SlashDB CSV Response</title>
  <script src="https://d3js.org/d3.v4.min.js"></script>
  <script src="http://rawgit.com/jamesleesaunders/d3-ez/master/build/d3-ez.js"></script>
  <link rel="stylesheet" type="text/css" href="http://rawgit.com/jamesleesaunders/d3.ez/master/build/d3-ez.css" />
</head>

<body>
  <div id="chartholder"></div>
  <br/>
  <div>Value: <span id="message"></span></div>

  <script type="text/javascript">

    dateConvert = function(dateYMD) {
      parser = d3.timeParse('%Y-%m-%d');
      var dateUnix = new Date(dateYMD)/1000;
      return dateUnix;
    };
        //  Using SlashDB to filter on Canadinan Invoices and their totals per their order (invoicing) days
    d3.csv("https://demo.slashdb.com/db/Chinook/Invoice/BillingCountry/Canada/InvoiceDate,Total,BillingCountry.csv", function(error, csv) {

      var colors = d3.ez.colors.categorical(3);
      var chart = d3.ez.chart.lineChart()
        .colors(colors)
        .yAxisLabel("Invoice Total");
      var legend = d3.ez.component.legend().title("Sum of Invoice Line Items");
      var title = d3.ez.component.title().mainText("SlashDB Meets D3").subText("Using CSV-Based Response");

      // Convert csv to d3-ez data format
      data = [ {key: "Total Price", values: []} ];
      d3.map(csv).values().forEach(function(d) {
      	data[0].values.push({key: dateConvert(d.InvoiceDate), value: d.Total});
      });

      // Create chart object
      var myChart = d3.ez.chart()
        .width(1250)
        .height(500)
        .chart(chart)
        .legend(legend)
        .title(title)
        .on("customValueMouseOver", function(d, i) {
          d3.select("#message").text(d.value);
        });

      d3.select('#chartholder')
        .datum(data)
        .call(myChart);
    });

  </script>
</body>

</html>
The output is displayed as:
D3.js Extension: D3plus
Now, let’s look at another D3 extension called d3plus ( http://www.d3plus.org ). Its library and helpful documentation about the extension can be found at: https://github.com/alexandersimoes/d3plus .
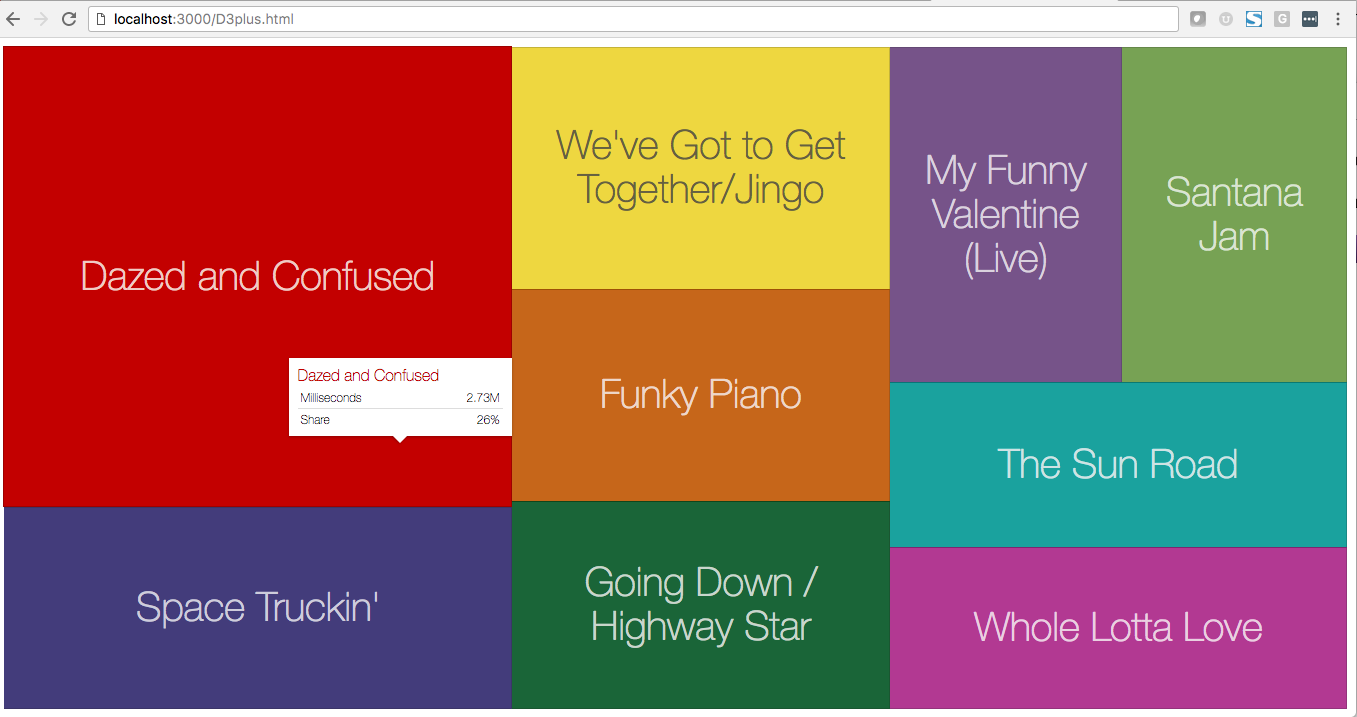
In the following example, we use SlashDB’s query string parameter, limit, to reduce the number of songs from the Chinook database to just 10. Then we’ll sort the time length of the tracks in descending order to find the 10 longest recordings.
The query is:
http://demo.slashdb.com/db/Chinook/MediaType/MediaTypeId/1/Track/Name,Milliseconds.html?sort=-Milliseconds&limit=10
We filtered for the MediaTypeID of 1 which are MPEG audio files.
Let’s see how D3plus can be used to produce a Treemap. A treemap recursively subdivides a single area into rectangles.
<!DOCTYPE html>
<meta charset="utf-8">

<!-- load D3js -->
<script src="//d3plus.org/js/d3.js"></script>

<!-- load D3plus after D3js -->
<script src="//d3plus.org/js/d3plus.js"></script>

<!-- create container element for visualization -->
<div id="TrackSizesContainer"></div>

<script>

// load the data
  d3.xml("http://demo.slashdb.com/db/Chinook/MediaType/MediaTypeId/1/Track/Name,Milliseconds.xml?sort=-Milliseconds&limit=10",
    function(error, data) {
	   data = [].map.call(data.querySelectorAll("Track"), function(Track) {
       return {
         Name: Track.querySelector("Name").textContent,
         Milliseconds: +Track.querySelector("Milliseconds").textContent
     };
   });
  // instantiate d3plus
  var visualization = d3plus.viz()
    .container("#TrackSizesContainer")  // container DIV to hold the visualization
    .data(data)  // data to use with the visualization coming from SlashDB
    .type("tree_map")   // visualization type
    .id("Name")         // key for which our data which is the name of song
    .size("Milliseconds")      // sizing of blocks in the treemap
    .draw()             // finally, draw the visualization!   */

  });
</script>
The output of this short program is:
Conclusion
Data visualization is a process of mapping data to visuals. Data in, visual properties out. The mapping rules are up to you, for example, larger number, taller vertical bars in a bar chart. And with the power of SlashDB to grab data as an intuitively expressed connected resource, you’ll quickly be on your way to bind those server-side data input values to elements in the DOM – a perfect match up of D3 and SlashDB.